
The Monitor tab is the default view inside Composer's System Check section. It gives Super Users a live view of enrichment activity across all transactional nodes in the selected service — showing what has run, what is running, and what failed — and provides controls to trigger and maintain enrichment jobs without leaving Composer.
What is enrichment? Enrichment is the process of resolving GTM entity mappings and stamping an InstId value on each row of a transactional node. The InstId links each transactional record to its corresponding master data entity, enabling cross-entity filtering, lookups, and relationships throughout TADA. Without enrichment, transactional data cannot be joined to the master data model.
Table of Contents
- Prerequisites
- Accessing Monitor
- Categories Panel
- Enrichment Log Table
- Aggregated Stats Panel
- Enrichment Actions
- Tips
Quick start: Select Enrichment in the Categories panel → use the Nodes dropdown to filter to a specific node → select exactly one node to reveal the action buttons → use Enrich, Optimize, or Flush as needed → monitor results in the log table and Aggregated Stats panel.
Prerequisites
- Access to Composer
- Super User permission on the target application
- At least one transactional node configured on the selected service
Accessing Monitor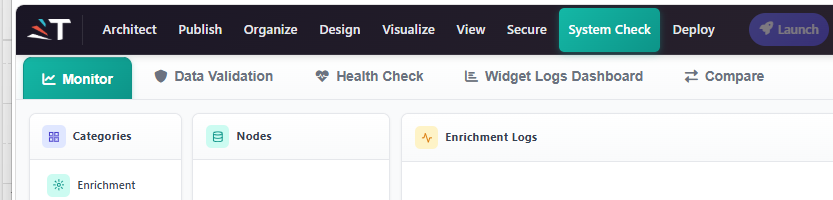
- Open Composer and select your cloud, model, and model partition.
- Click System Check in the top navigation.
- Monitor opens automatically as the default tab. To return to it from another tab, click Monitor in the System Check tab bar.
Categories Panel
The leftmost panel lists monitoring categories. Enrichment is currently the only available category. Select it to load the enrichment log in the centre panel.
Enrichment Log Table
The centre panel shows the enrichment run history across all nodes for the selected service. Use the controls at the top to filter the log:
| Control | Description |
|---|---|
| Nodes dropdown | Checkbox-dropdown with search — select one or more nodes to filter the log. Select exactly one node to enable the action buttons. |
| Date-range picker | Filters log entries by run date. Defaults to the last 24 hours. |
| Status pills | Filter by run status: All, Completed, In Progress, Failed, Queued |
| Text filter | Search within log entries by keyword |
Each row in the log table shows:
| Column | Description |
|---|---|
| Status | Completed, In Progress, Failed, or Queued |
| Node | The transactional node this run belongs to |
| Semantic Item | The GTM entity mapping that was enriched |
| Started On | When the run began |
| Completed On | When the run finished (blank if still running) |
| Progress | For completed runs: a green 100% badge. For running jobs: a live progress bar showing rows processed vs. total rows and percentage complete, updating after each batch. For queued runs: a dash. |
| Description | Detail about the run result or error |
| Requested By | The user or system that triggered the run |
When any log entry has status In Progress, the log panel refreshes automatically every 5 seconds so progress stays current without a manual reload.
Aggregated Stats Panel
The right panel provides a real-time summary of enrichment health across the selected nodes and date range. Stats update automatically as you change filters in the log table.
| Stat | Description |
|---|---|
| Success Rate | Percentage of enrichment runs that completed successfully within the selected filters |
| Top Failing Nodes | The three nodes with the highest failure count — useful for identifying problem areas at a glance |
| Average Completion Time | Mean duration across all completed runs in the filtered view |
| Duration Trend Chart | Hourly or daily chart of enrichment run durations — switch between views to spot patterns or degradation over time |
Enrichment Actions
Select exactly one node using the Nodes dropdown to reveal the action buttons. Actions target only the selected node.
| Action | What it does | When to use |
|---|---|---|
| Enrich | Runs the full enrichment pipeline — resolves GTM entity mappings and writes InstId values to all matching rows. Runs in paginated batches so large tables complete without timeout. | After new data is loaded or a mapping changes and you need InstId values updated immediately rather than waiting for the next scheduled run. |
| Optimize | Re-indexes the enrichment data for that node. | After a large data import or a structural mapping change that may have left the index stale. |
| Flush | Clears all InstId values for every row in that node. This is irreversible — rows will have no InstId until a new Enrich run completes. | When you need to fully reset a node's enrichment state, for example after a significant data model change. |
Tips
- Enrich vs. Optimize: Run Enrich when data has changed (new rows, updated mappings). Run Optimize when performance has degraded after a large import — it does not re-enrich rows, only re-indexes existing InstId values.
- Flush is permanent: There is no undo. Only flush a node if you intend to re-enrich it immediately afterward. Launcher users will see no enriched data on that node until the next Enrich run completes.
- Batch size: Enrichment runs in pages of 100,000 rows. Progress updates after each page, so the progress bar will jump in increments for very large tables — this is expected behavior. If a page fails, the system retries it up to 3 times before marking it as failed and moving on to the next page.
- Use date-range filtering: The log defaults to the last 24 hours. Widen the date range to investigate recurring failures or review enrichment history after a major data load.
- Watch the Top Failing Nodes: If the same node keeps appearing in the Aggregated Stats panel's top failing list, investigate its mappings or data quality — repeated failures on one node usually signal a mapping misconfiguration or a data type mismatch.
Related: Data Validation | Health Check — System Validation | Widget Logs Dashboard